The screener
The screener is the whole Stream Markets database as one table you can filter, sort and save. Pick a dataset, add the columns you care about, filter any column, and keep the result as a report you can come back to, watch or export. It is a Pro tool - the free browse tables cover the same data with fixed columns.
One table, ten datasets
Say you want producers under a $500M market cap. Open the screener on the Companies tab, filter the Stage column to Producer from the funnel icon in its header, set a maximum on the Market cap column the same way, and sort by market cap. The header tells you how many companies match, and the result can be saved as a report - the strip above the table in the shot below holds one saved exactly this way.
The tabs along the top switch the dataset. Each one is its own table with its own columns and filters: Companies, Projects, Resources, Economics, Deals, Production, News, Catalysts, Insiders and Documents, plus the Builder for queries that span tables. Work is preserved independently on every tab, so moving from Companies to Projects and back restores the Companies filters, columns and sort exactly as you left them. An amber dot marks a tab with an unsaved recovery draft.

- Tabs - Companies, Projects, Resources, Economics, Deals, Production, News, Catalysts, Insiders, Documents and the Builder.
- Header readout - how many rows match and how many columns are showing, for example 151 / 2,779 rows and 10/29 cols.
- Export - CSV or Excel of the screen you built, covered in the exports guide.
- Reports - your saved screens and the templates, one click away.
- Columns - the column picker for the current dataset.
Columns and filters
Every dataset holds more fields than it shows by default - the Companies tab in the shot above shows 10 of 29 columns. The Columns button and the + N more fields link both open the picker, which lists every field we hold on that dataset. Add what you need, take away what you do not, and the header count follows.
Filtering happens in two places. Every column header carries a funnel icon: click it to filter that column. The Filter rows box above the table searches the table as a whole, and the search runs on the server across every matching row, not just the rows on screen.
- Funnel icon - per-column filters, in the column header itself.
- + N more fields - opens the column picker; the number is how many fields the dataset holds beyond what is showing.
- Filter rows - a search box over the whole table. Press / to focus it.
- Active filters - each one shows as a chip above the table; remove a chip to widen the screen.
What the row count means
The header counts matches against the whole database - the shot reads 151 / 2,779 rows. Filters, search and sort all run on the server across every matching row, so the match count is real - it is never a truncated sample. On a wide screen the table loads the first 1,000 matches automatically; paging past what is loaded, or pressing Load more, pulls the next chunk. Column totals at the foot of the table are computed over the loaded rows, and say so whenever that is less than the full match set.
Saving what you build
A report is a screen you saved: one dataset with its columns, filters, search and sort. Use Save screen to keep the current view. Research screens opens the library of templates and your saved reports, each with its dataset, column count, filters and when you saved it. Templates are ready-made starting points you can open and adapt.
Tick Watch this report when you save, or use the controls under any saved report, and we re-run it throughout the day and tell you when a new row matches it, or when a row already in it changes. Market prices are ignored, so daily quote moves never trigger an alert. You can watch up to 10 reports at a time. Reports have their own guide at saved reports.
- Save the screen you are on - name the current view and save it as a report.
- Open, rename, delete - on every saved report row in Research screens.
- When its rows change - Off, Notify me, or Notify and email, set per report. The dialog spells out exactly what a watch covers.
The Builder
The Builder is for questions one table cannot answer on its own. Pick the dataset to screen, add field conditions, then add linked-table conditions that reach into related tables. The example below screens deals: financings announced in the last 730 days, where the target company’s commodity is lithium and its market cap is under $100M. Conditions combine with and, the match count updates as you build, and the result is a normal screener table - columns, export and saving as a report all work the same way.
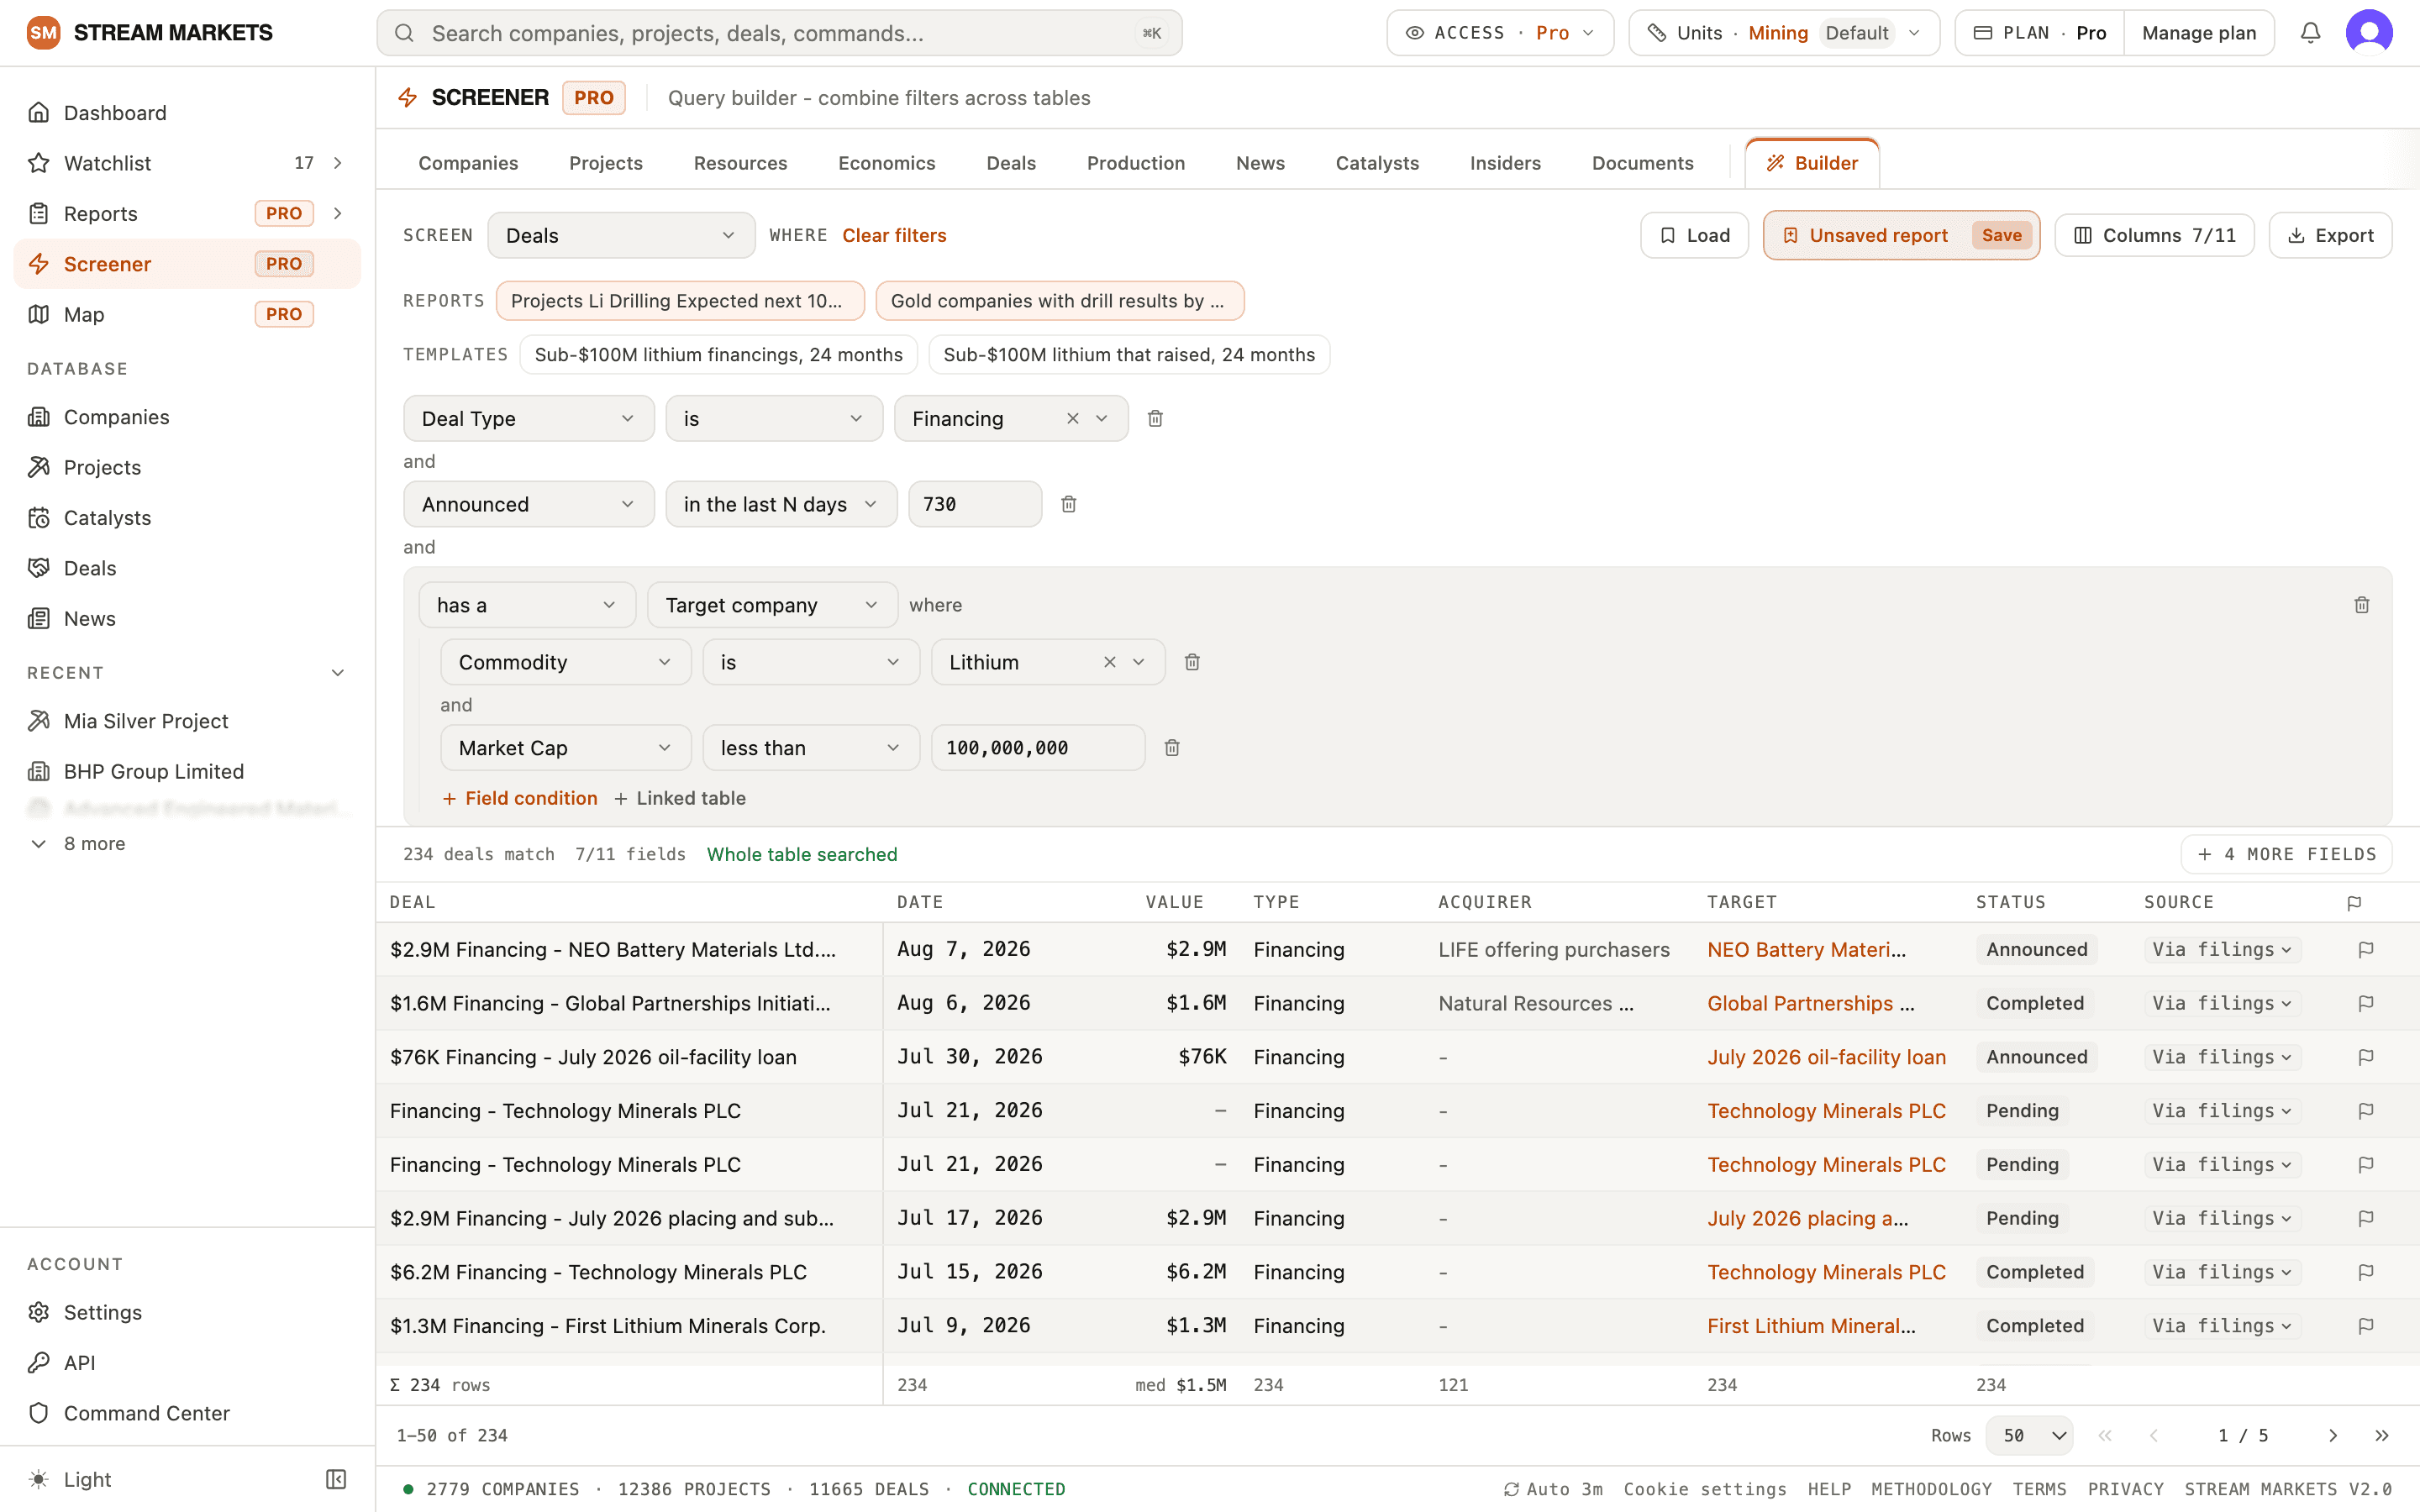
- Screen - the dataset the query runs on.
- + Field condition - adds a condition on a column of that dataset.
- + Linked table - adds a condition on a related table, like the target company behind a deal.
- Save and Load - a built query saves as a report like any other screen.
- Switching the Screen dataset preserves the query under its original dataset and restores it when you return.
Not on Pro?
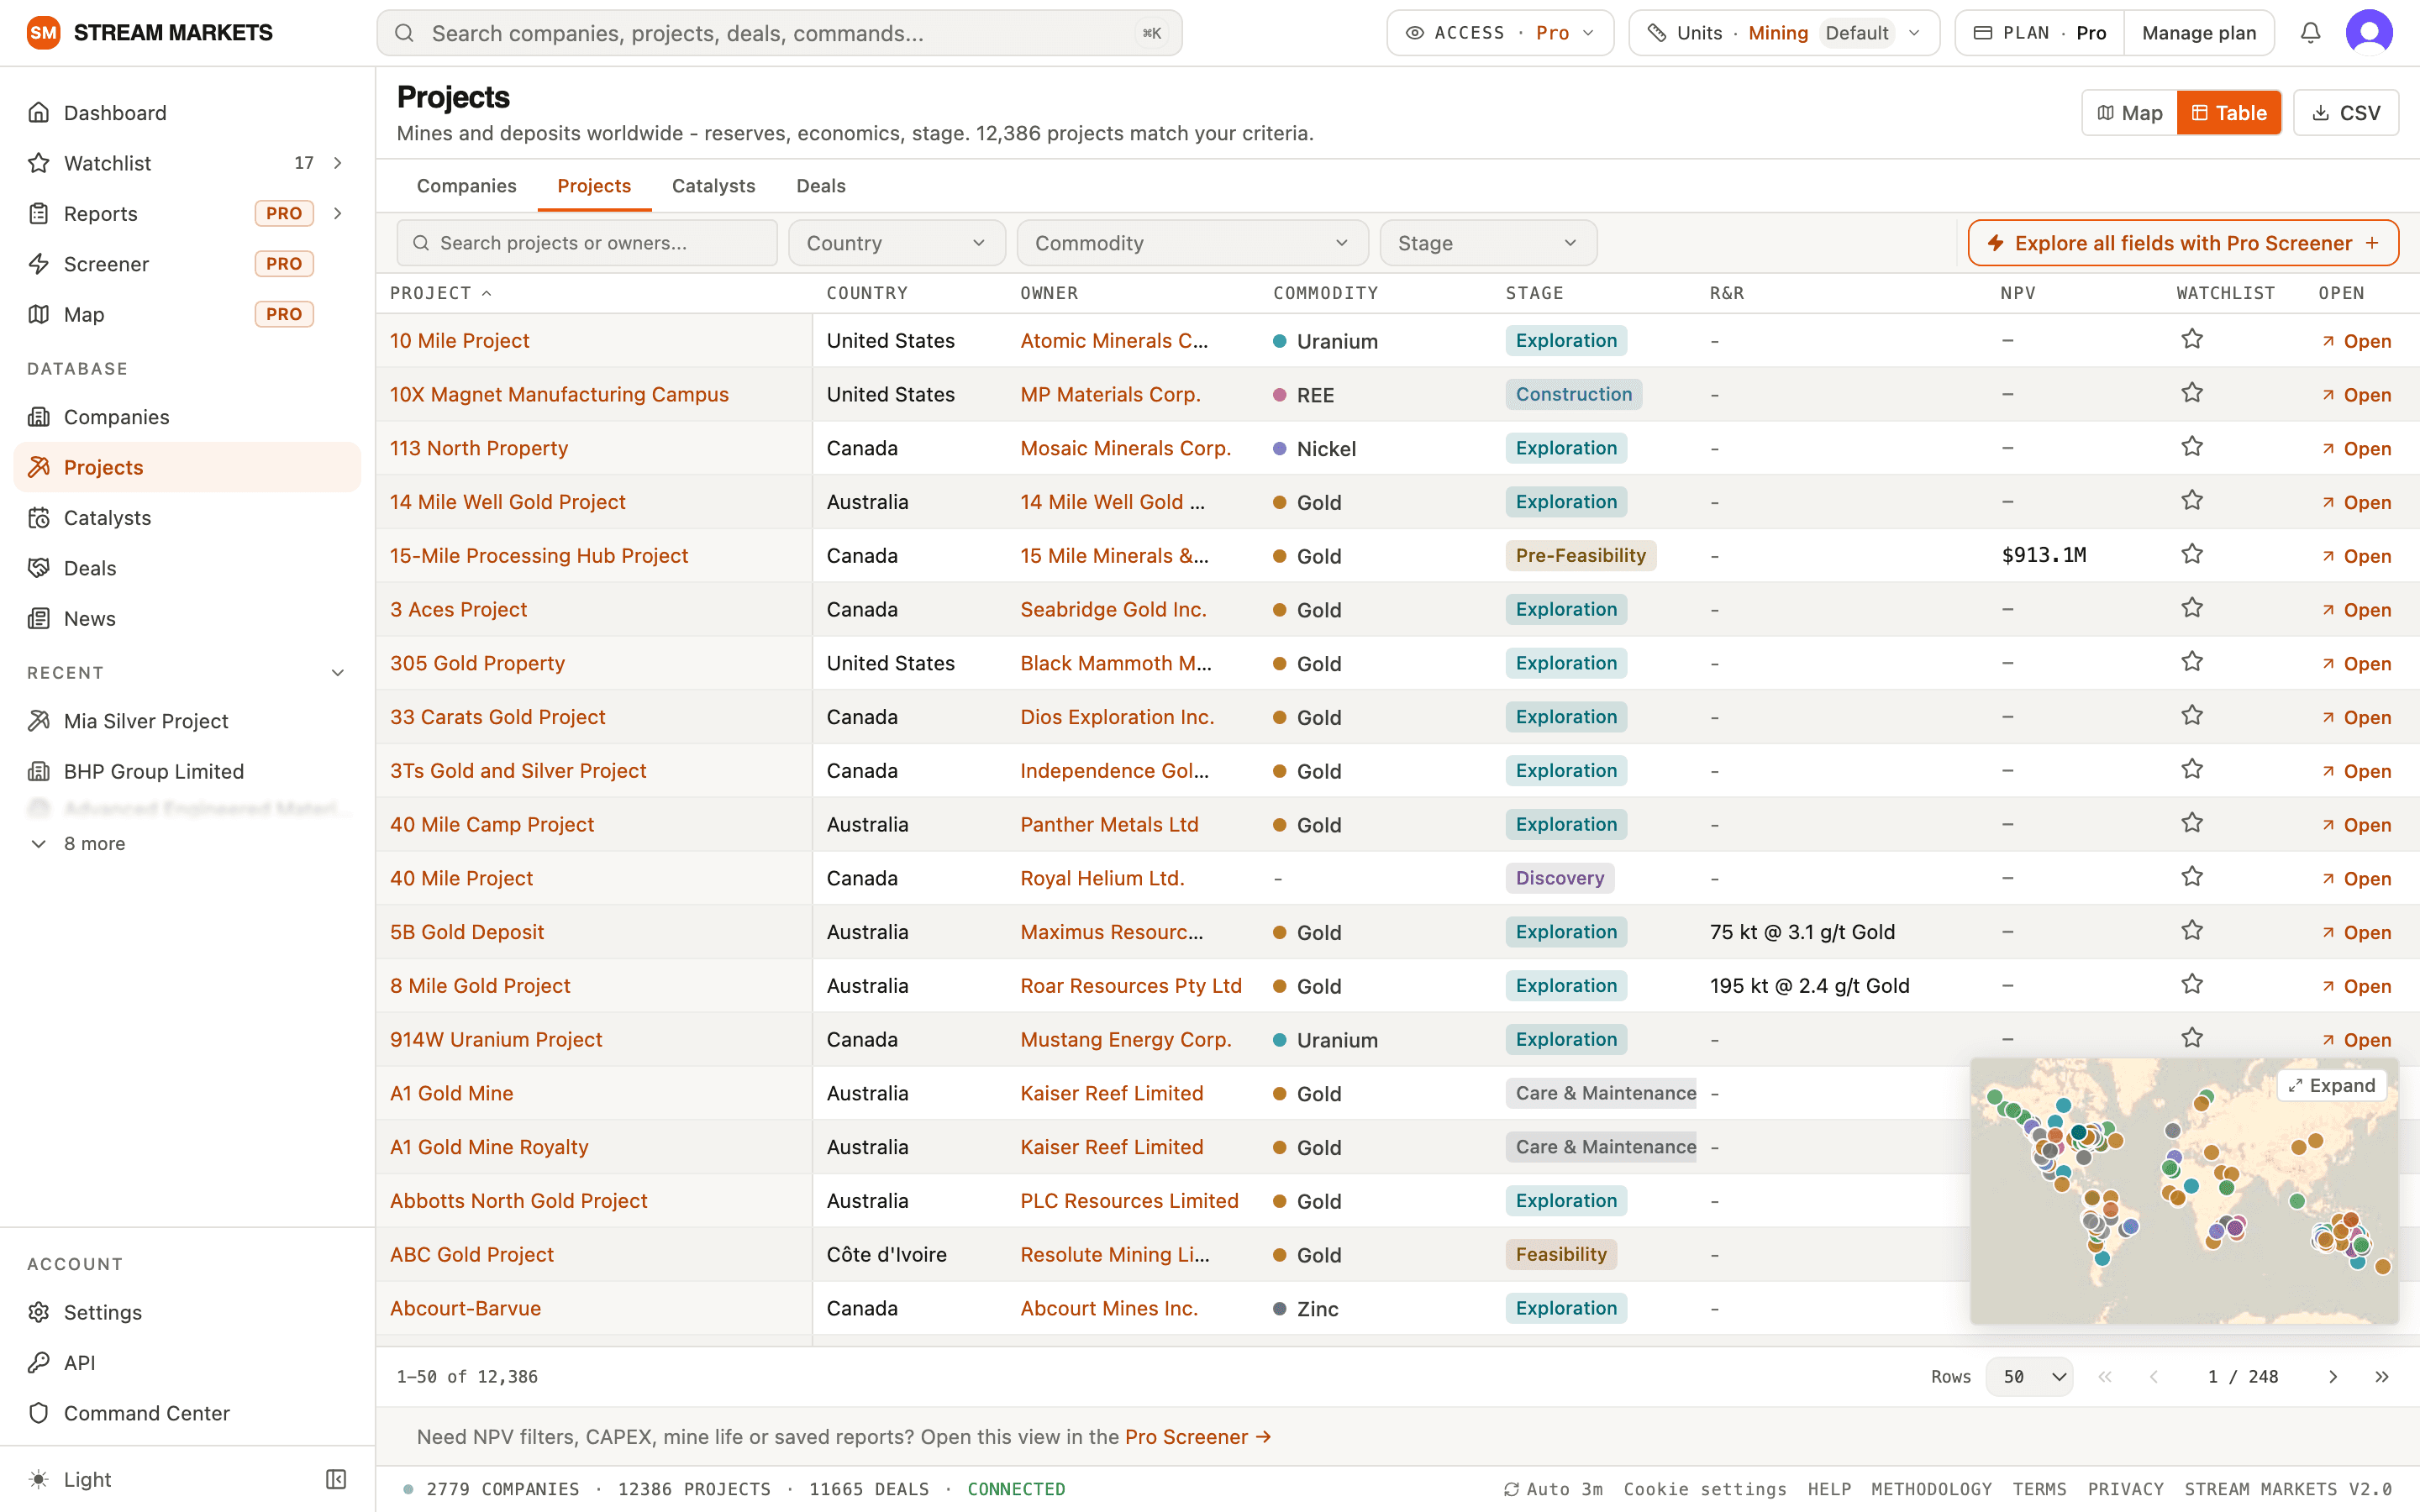
The screener is a Pro tool. The free browse tables - companies, projects, catalysts, deals and news, in the sidebar under Database - cover the same data with a fixed set of columns and simple filters for country, commodity and stage. Every browse table carries an Explore all fields with Pro Screener link that opens the same view in the screener.
New here? The getting started guide tours the whole app. When your screen is ready to leave the app, the exports guide covers CSV and Excel.
Quick steps
- Open Pro Screener and select the dataset, or choose Builder for a report combining related datasets.
- Set search, column filters, columns and sorting. Inspect the preview and matching count.
- Save screen to keep the configuration; use Export to download results. Enable report alerts separately.
Filtering and understanding results
- Choose the dataset first: companies, projects, resources, economics, deals, production, news, catalysts or documents. Use column filter controls and Columns to adjust the table.
- Numeric and date filters need the units and date field shown by the control. Display units can be changed in Settings; that preference does not rewrite stored data.
- Check existing filters and search when a new filter returns no rows. Remove constraints one at a time. Missing data is not zero and may not match a numeric condition.
- The count describes rows in the selected dataset. Several resource estimates may belong to one project; a row count is not a unique-company count. Pivot groups estimates and is not permission to sum overlapping categories.
Builder and saving
- Builder starts from a base dataset and lets you add supported related data, criteria and output columns. Review the result grain: joining estimates or events can yield several rows for one company.
- If Builder rejects a relationship, field or overly broad query, use the offered relationships, fewer conditions or a narrower base population. Do not assume arbitrary joins are supported.
- Save keeps the configuration as a named report. Save as new preserves the existing report and creates another. Local recovery drafts preserve unsaved work when browser storage is available; only Save updates the named report.
- Full Screener and saving require Pro. On the Free plan a Pro table shows its first rows, not the whole table.