Exports
Anything you can see in a table, you can take with you. This page walks one export end to end, then covers the formats, the daily row allowance each plan gets, and what happens when you reach it.
From a screen to a spreadsheet
Say you want producers under $500M market cap in a spreadsheet. Open the screener, filter the Stage column to Producer and the Market cap column to under $500M, and add any columns you want in the file - the export contains exactly the columns and rows you are looking at. Then press Export in the top bar and choose Excel - fixed units. A .xlsx file downloads, and it opens straight into Excel, Google Sheets or Numbers with your filters already applied.

- Screener - the Export button in the top bar. Exporting what you build here is a Pro tool.
- Free browse tables (Companies, Projects, Deals and the rest under Database) - the same Export menu. CSV export is included free on these tables; Excel export is part of Pro.
Formats and units
The Export menu offers each format twice, because units in mining data are messy - one company reports tonnes, the next reports million tonnes. The Analyst export converts every numeric column to one fixed unit, following the unit profile shown in the top bar, so the column maths works the moment the file opens. The Compatibility export keeps every value exactly as we store it.
- CSV - fixed units - one unit per numeric column, ready for analysis.
- Excel - fixed units - the same, as a .xlsx workbook.
- CSV - stored values - values exactly as stored, units as reported.
- Excel - stored values - the same, as a .xlsx workbook.
- API - shows code snippets that reproduce your current query, for anyone who wants the same rows programmatically.
The daily row allowance
Every account has one daily row allowance, and CSV exports, Excel exports and API calls all draw from the same pool. Only the rows actually returned count - a 2,000-row export uses 2,000 rows of allowance, no more. The allowance resets at midnight UTC every day.
- Free - 1,000 rows a day, through CSV export on the browse tables.
- Pro - 25,000 rows a day, shared with the API, and the screener’s exports unlock. The 7-day trial includes a limited allowance; the full limit unlocks when the trial converts.
- Pro+ - 150,000 rows a day, shared with the API.
Watching your usage
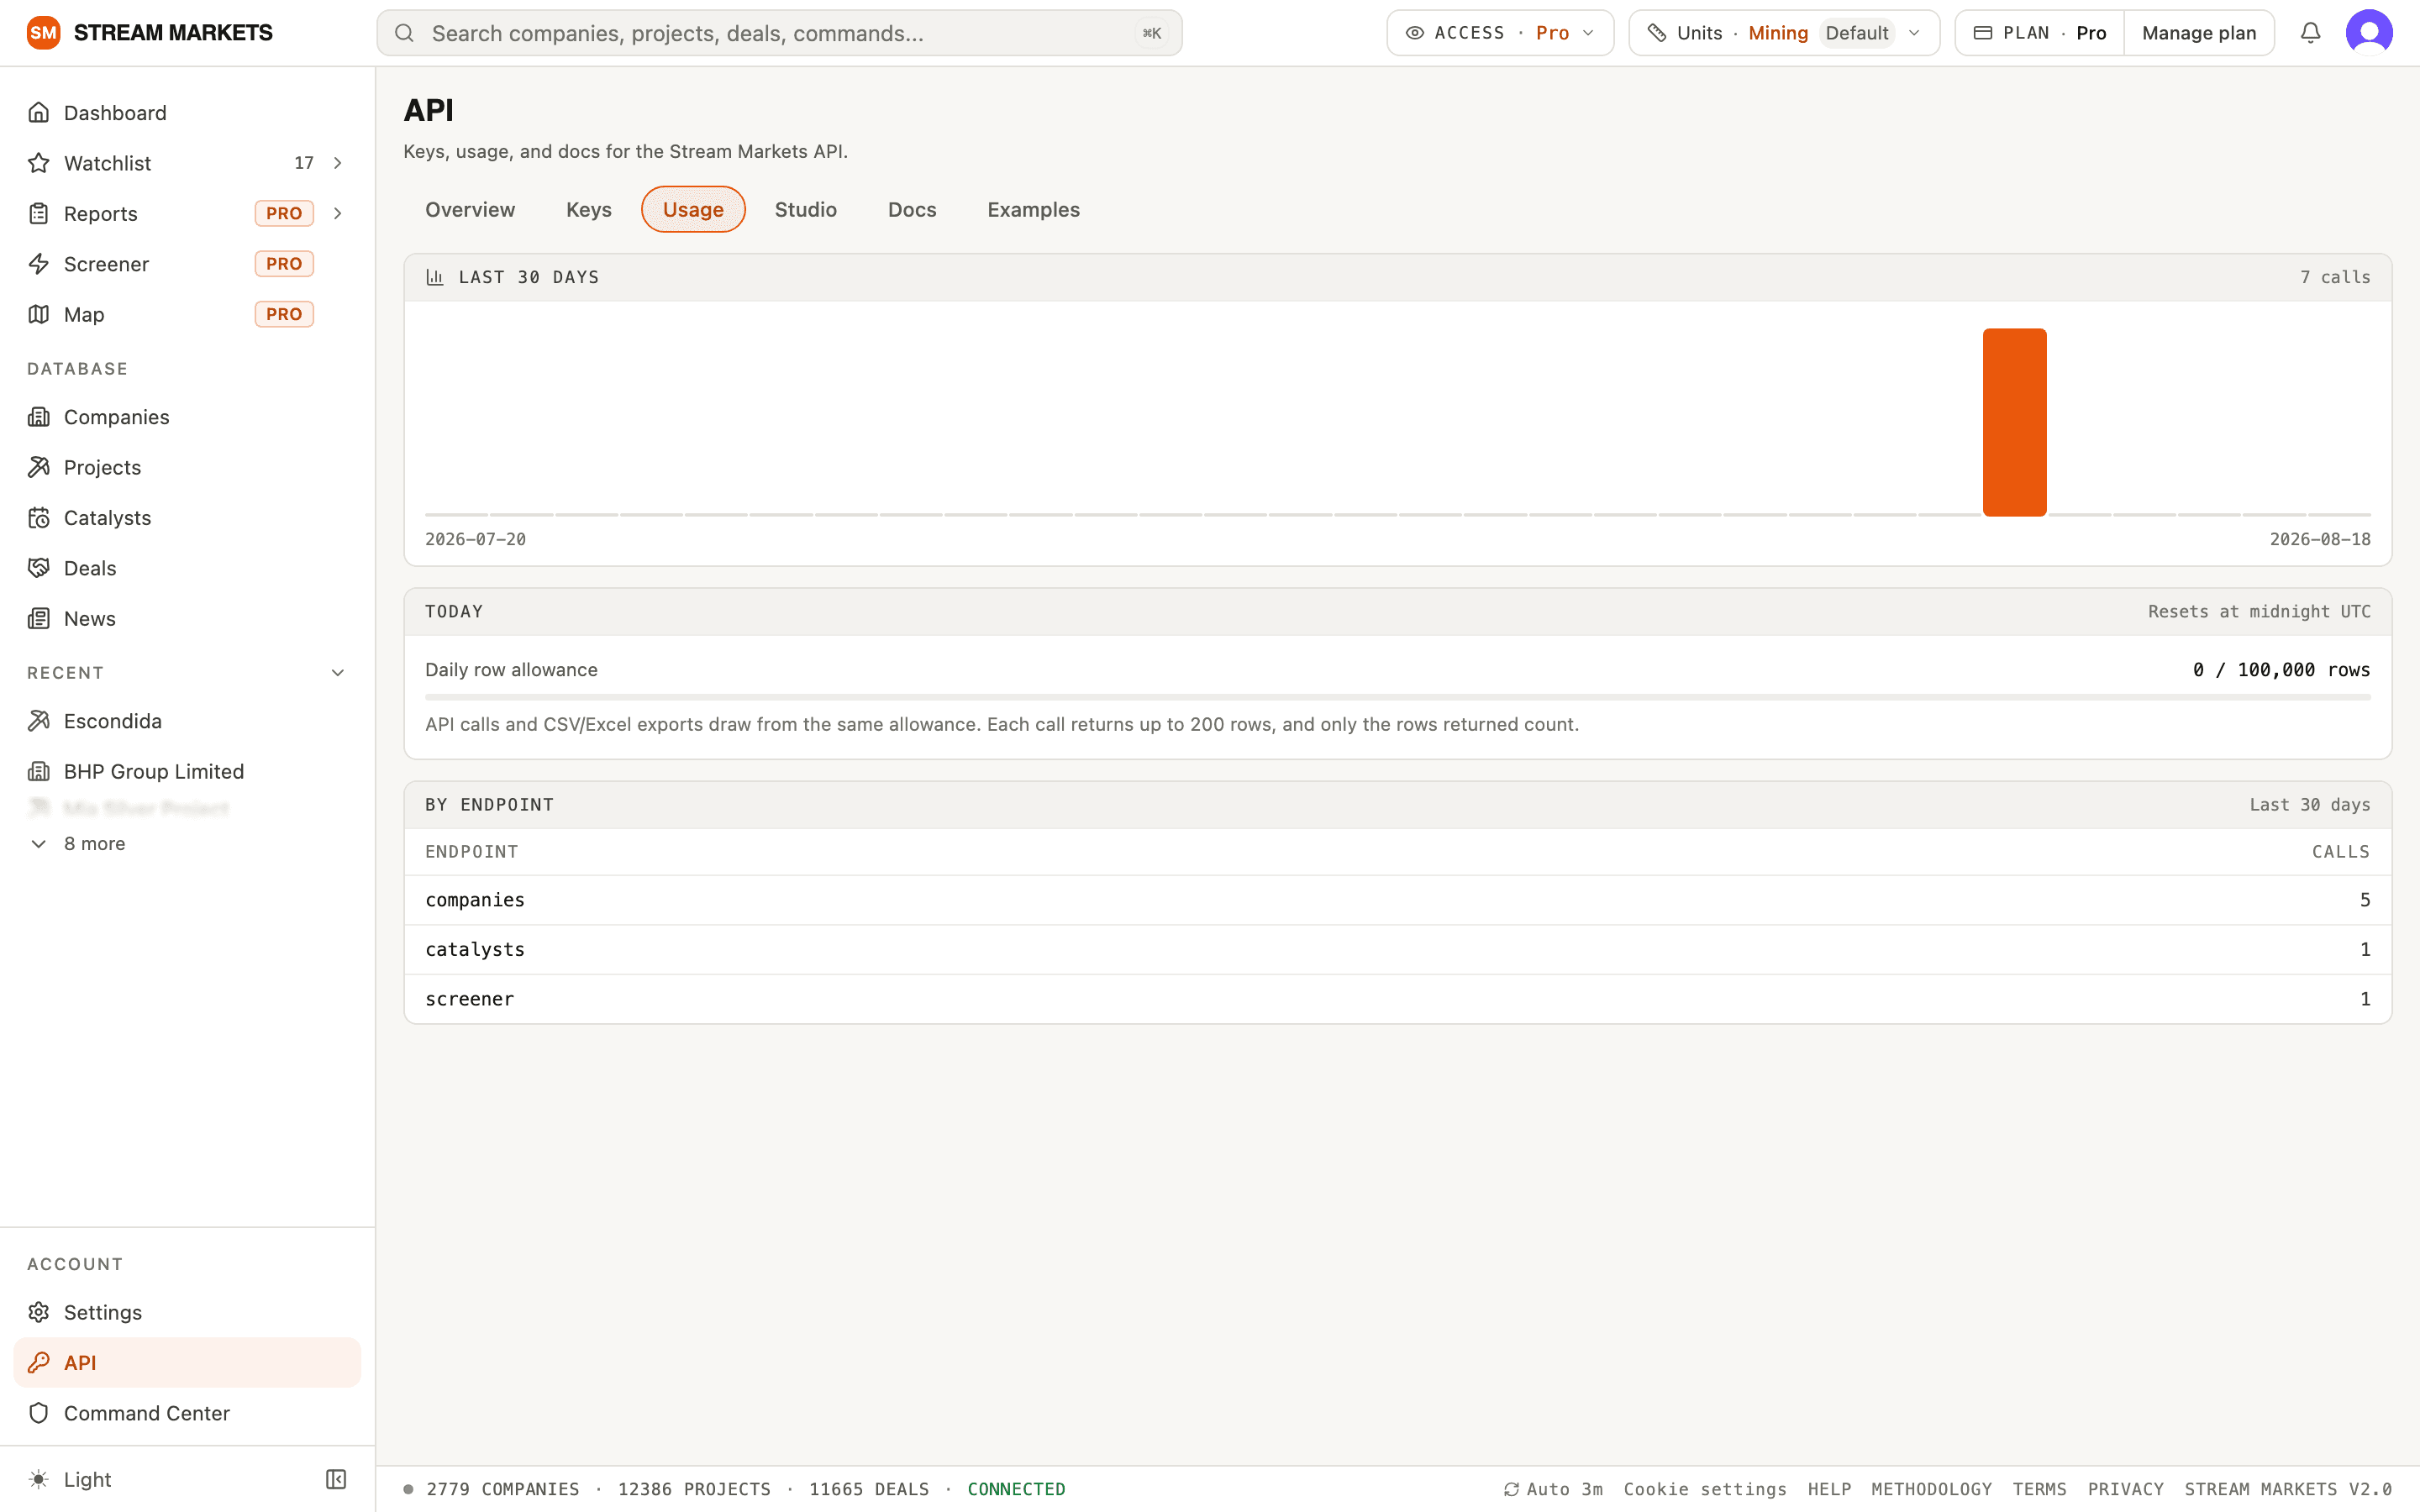
The API page in the sidebar, under Account, has a Usage tab that shows the shared allowance - today’s rows used against your limit, when it resets, a chart of the last 30 days and a table of calls by endpoint. It is the same meter whether the rows left through a spreadsheet or through code.
When an export is cut short
If a big export would go past what is left of today’s allowance, you still get a file - it holds the first rows that fit, and the toast tells you how many of the matching rows made it and that the allowance resets at midnight UTC. Very large result sets can also hit a per-export cap; narrowing the filters and exporting in slices fetches the rest.
Where next
Building the screen you want to export is covered in the screener guide, and saving it so the same export is one click next week is covered in reports. If you would rather pull rows in code, the REST API is documented for developers.
Quick steps
- Filter the table to the rows you need and choose Export.
- Choose CSV or Excel and check whether you need analyst units or stored values.
- Check the download’s row count and any partial-export notice. Exports and API reads share the daily row allowance.
Formats, units and usage
- CSV from the free browse tables is available on Free; Excel and exports from Pro Screener require the appropriate paid access. Current plan allowances are shown in Plans and pricing and API Usage.
- Analyst exports use explicit units for numeric columns. Stored-value formats preserve the underlying values and units. Read the headers and unit columns before comparing with the app’s t, kt or Mt display.
- API and export row usage share a daily pool that resets at midnight UTC. StreamBot research requests use a separate monthly allowance.
- An exported file is a snapshot. A saved report is a query that can return different rows later.
A download is missing or incomplete
- Read the export notice: allowance exhaustion and large-export caps can produce fewer rows than the full match count. Do not treat a partial file as the whole result.
- Reduce the filters to the rows needed or wait for the displayed allowance reset. Repeating a successful export may use more allowance.
- Check the browser’s Downloads list and whether downloads were blocked. If a request failed, note the error before retrying.
- If values look different in a spreadsheet, check units, number/date formatting and the chosen export format. Keep identifiers and tickers as text when importing CSV to preserve their formatting.